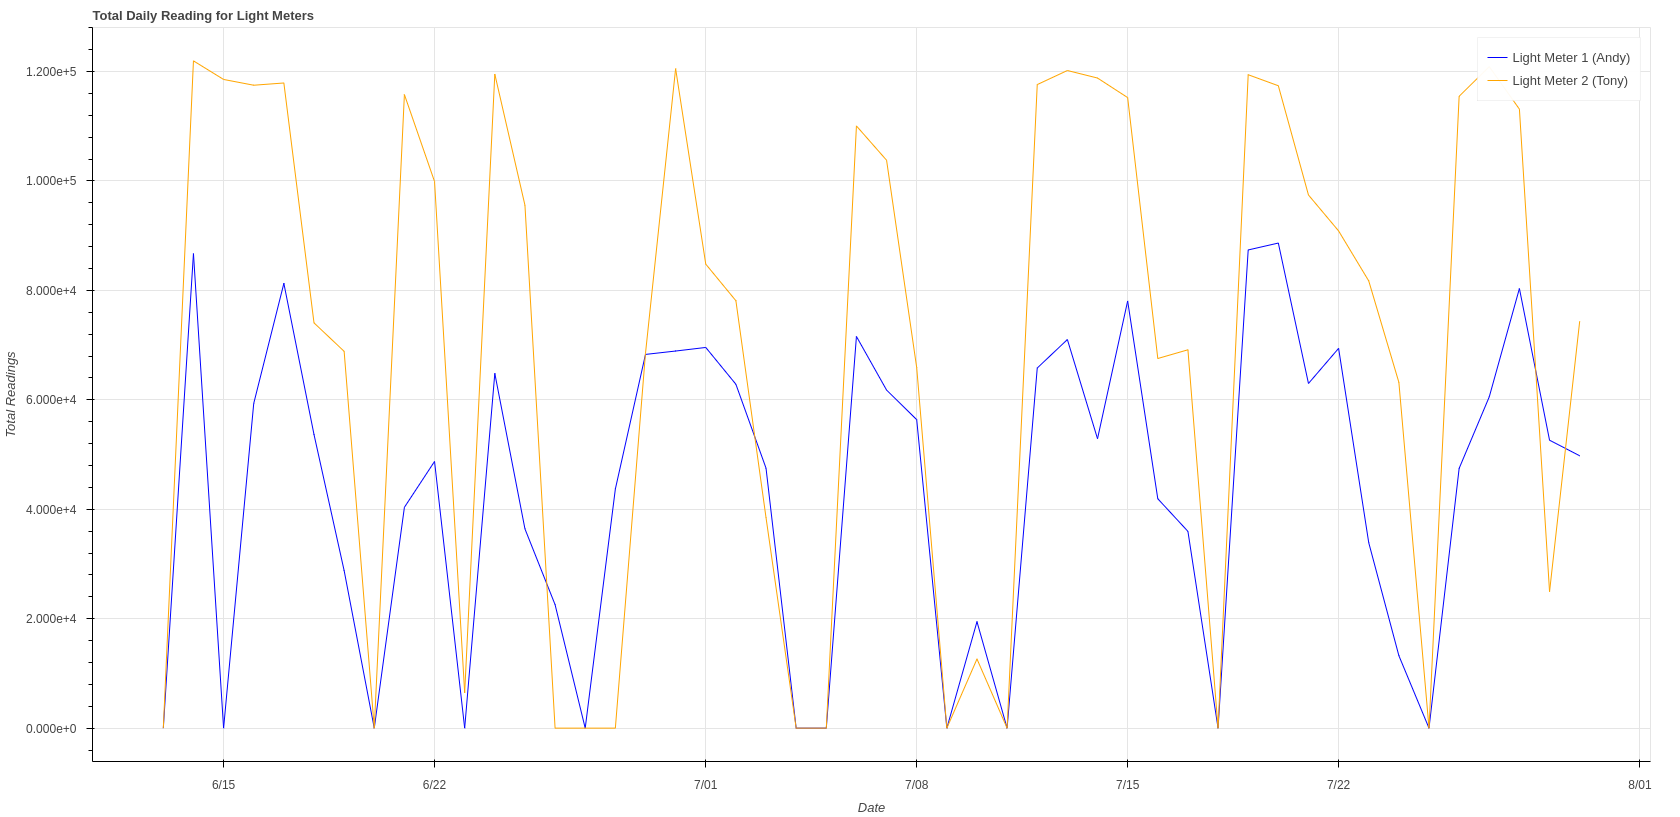
 Figure 1. Daily totals for Light Meter 1 and Light Meter 2
Ritherdon Charts is a (mostly) Python-based data-exploration project. It explores the data
recorded by the Personal Flash in Real-Time artworks, made by Nicola
Ellis.
The Personal Flash artworks recorded the light levels in the welding booths in
Ritherdon, during the No gaps in the
line
exhibition, hosted at Castlefield
Gallery.
With this project, I've taken those reading (from the Light Meters) and produced
a collection of charts for Nicola -- and you -- to review. The charts are
produced using Python's Bokeh
library. I've, also, used Bash scripts,
Awk and
ripgrep for some data processing
tasks. Oh, Pandas and Numpy
are sprinkled into the mix, as well.
Below are a few examples of the types of charts the data produced.
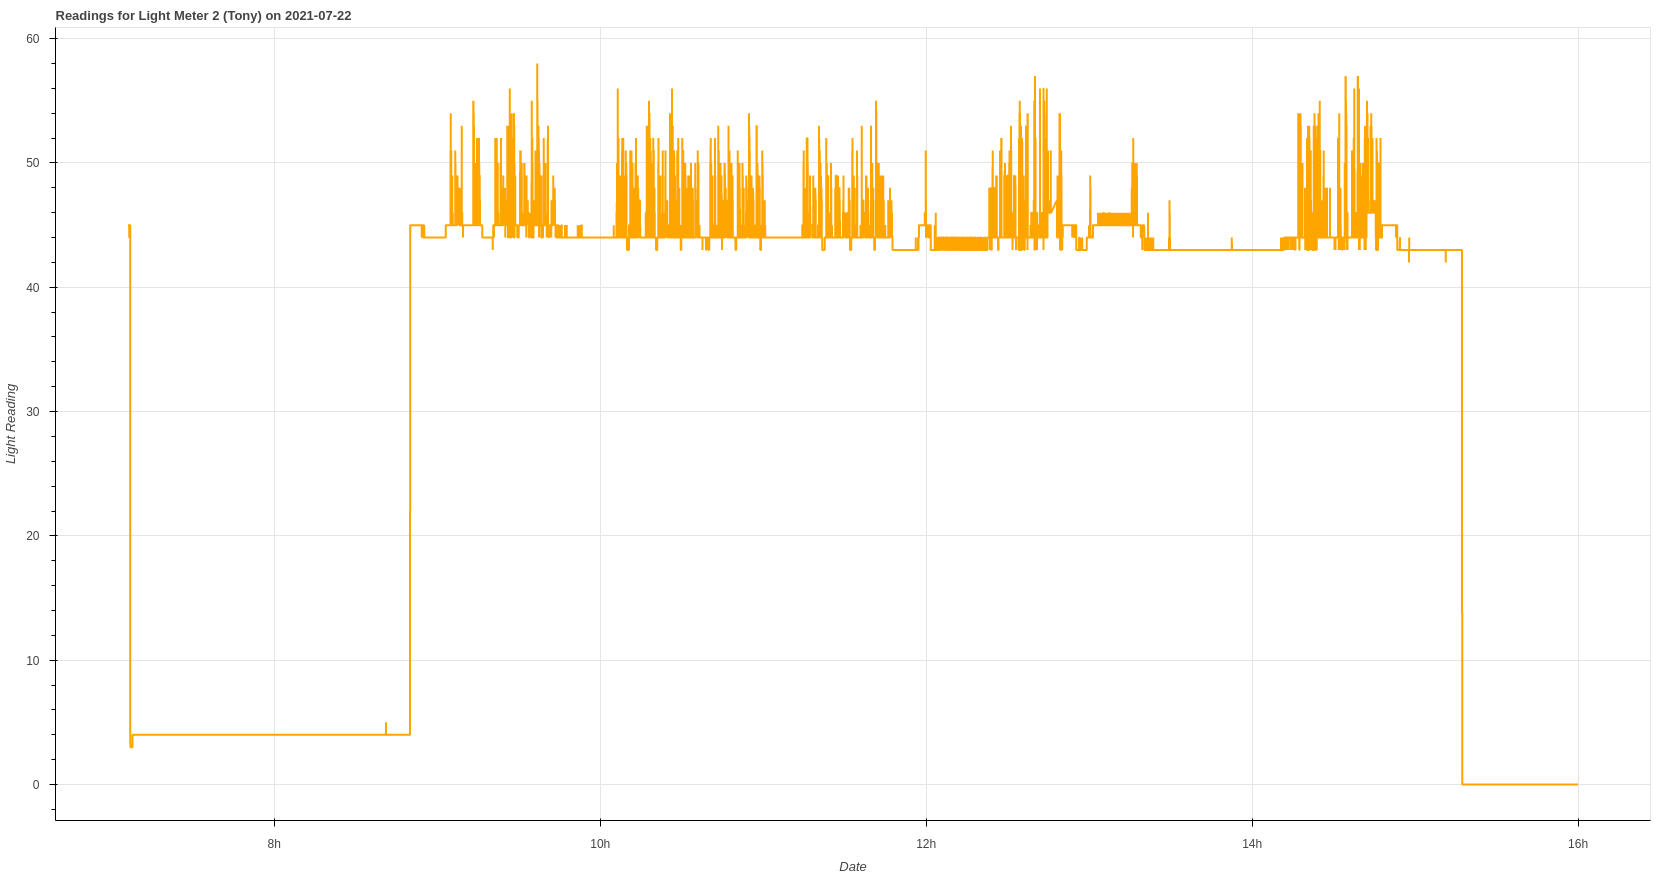 Figure 2. Readings from Light Meter 2 for 22nd July 2021
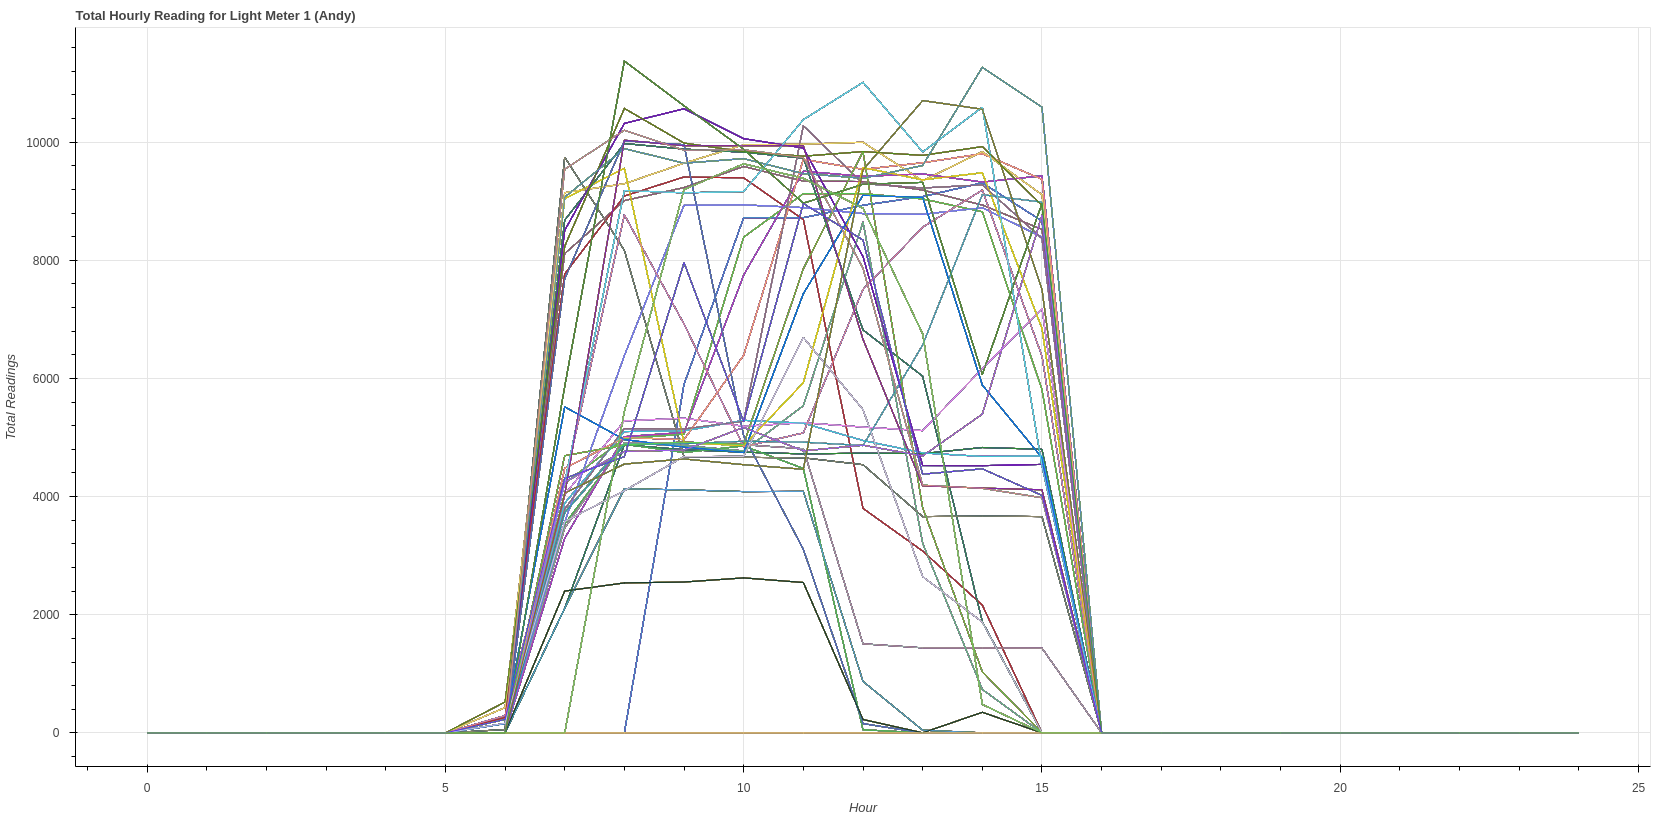 Figure 3. Total readings per hour for Light Meter 1
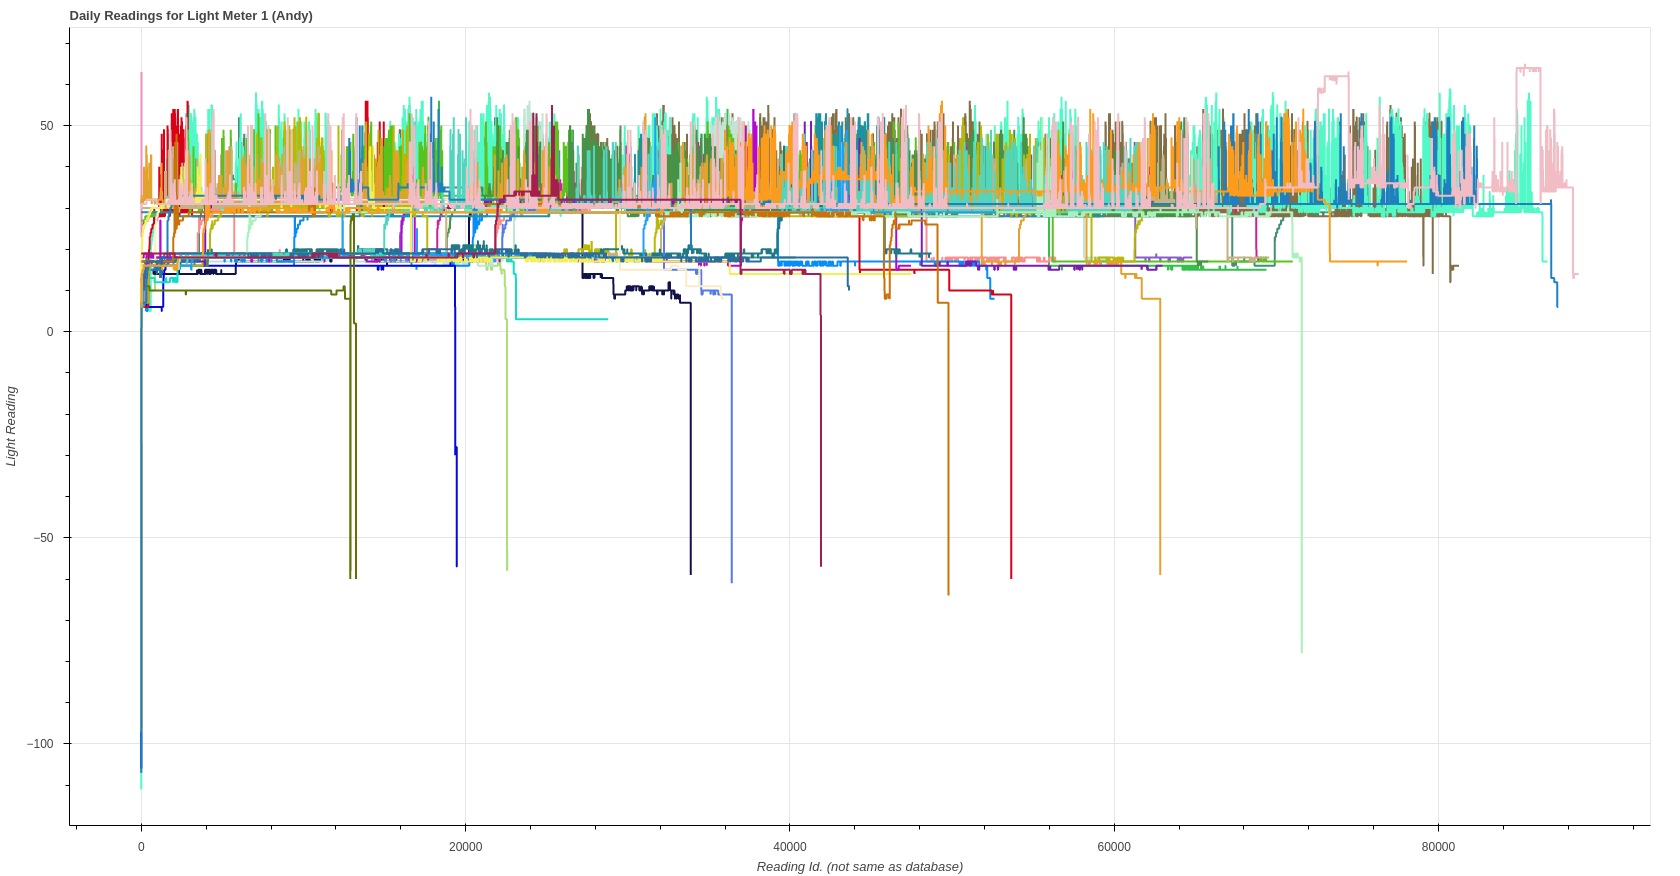 Figure 4. Light Meter 1's daily readings overlaid on top of each other
This project isn't directly related to the Return to
Ritherdon project. So, you won't find
it in the rtr-docs
repository. The work done in this project is just a bit of fun after the
fact.