CO-Data started out as a website
I developed to graph the data from this site. I wrote it in Python and use the
Bokeh library to produce the charts. I never got it past
the initial proof-of-concept phase, and it only displayed data for the Art
section of this site. Furthermore, I lost interest in it because the charts became finicky
once browsers started to include heightened privacy and security defaults (no
third-party cookies, HTTPS as default Etc.). I could have integrated the Bokeh
stuff into the site to alleviate some of the problems but I never got around to
that. It was, also, slow which forced me to develop
Skivvy (no longer active).
I should add here I re-wrote this (craigoates.net) website and used a
different database and schema after starting CO-Data and Skivvy. This meant I
needed to update the code for both of those projects and I never found the
motivation to do so. Because of this, they kinda lingered and their digital-bits
were left to rot.
With all that out of the way, I can now say I've repurposed CO-Data as a
literate-programming
project. It still focuses exploring this site's data, it's just without the
website part. The project now uses org-mode and Common
Lisp. Both are heavily tied to
Emacs but you can use other programs --
like Visual Studio Code with its
Alive plug-in -- if you prefer
something else.
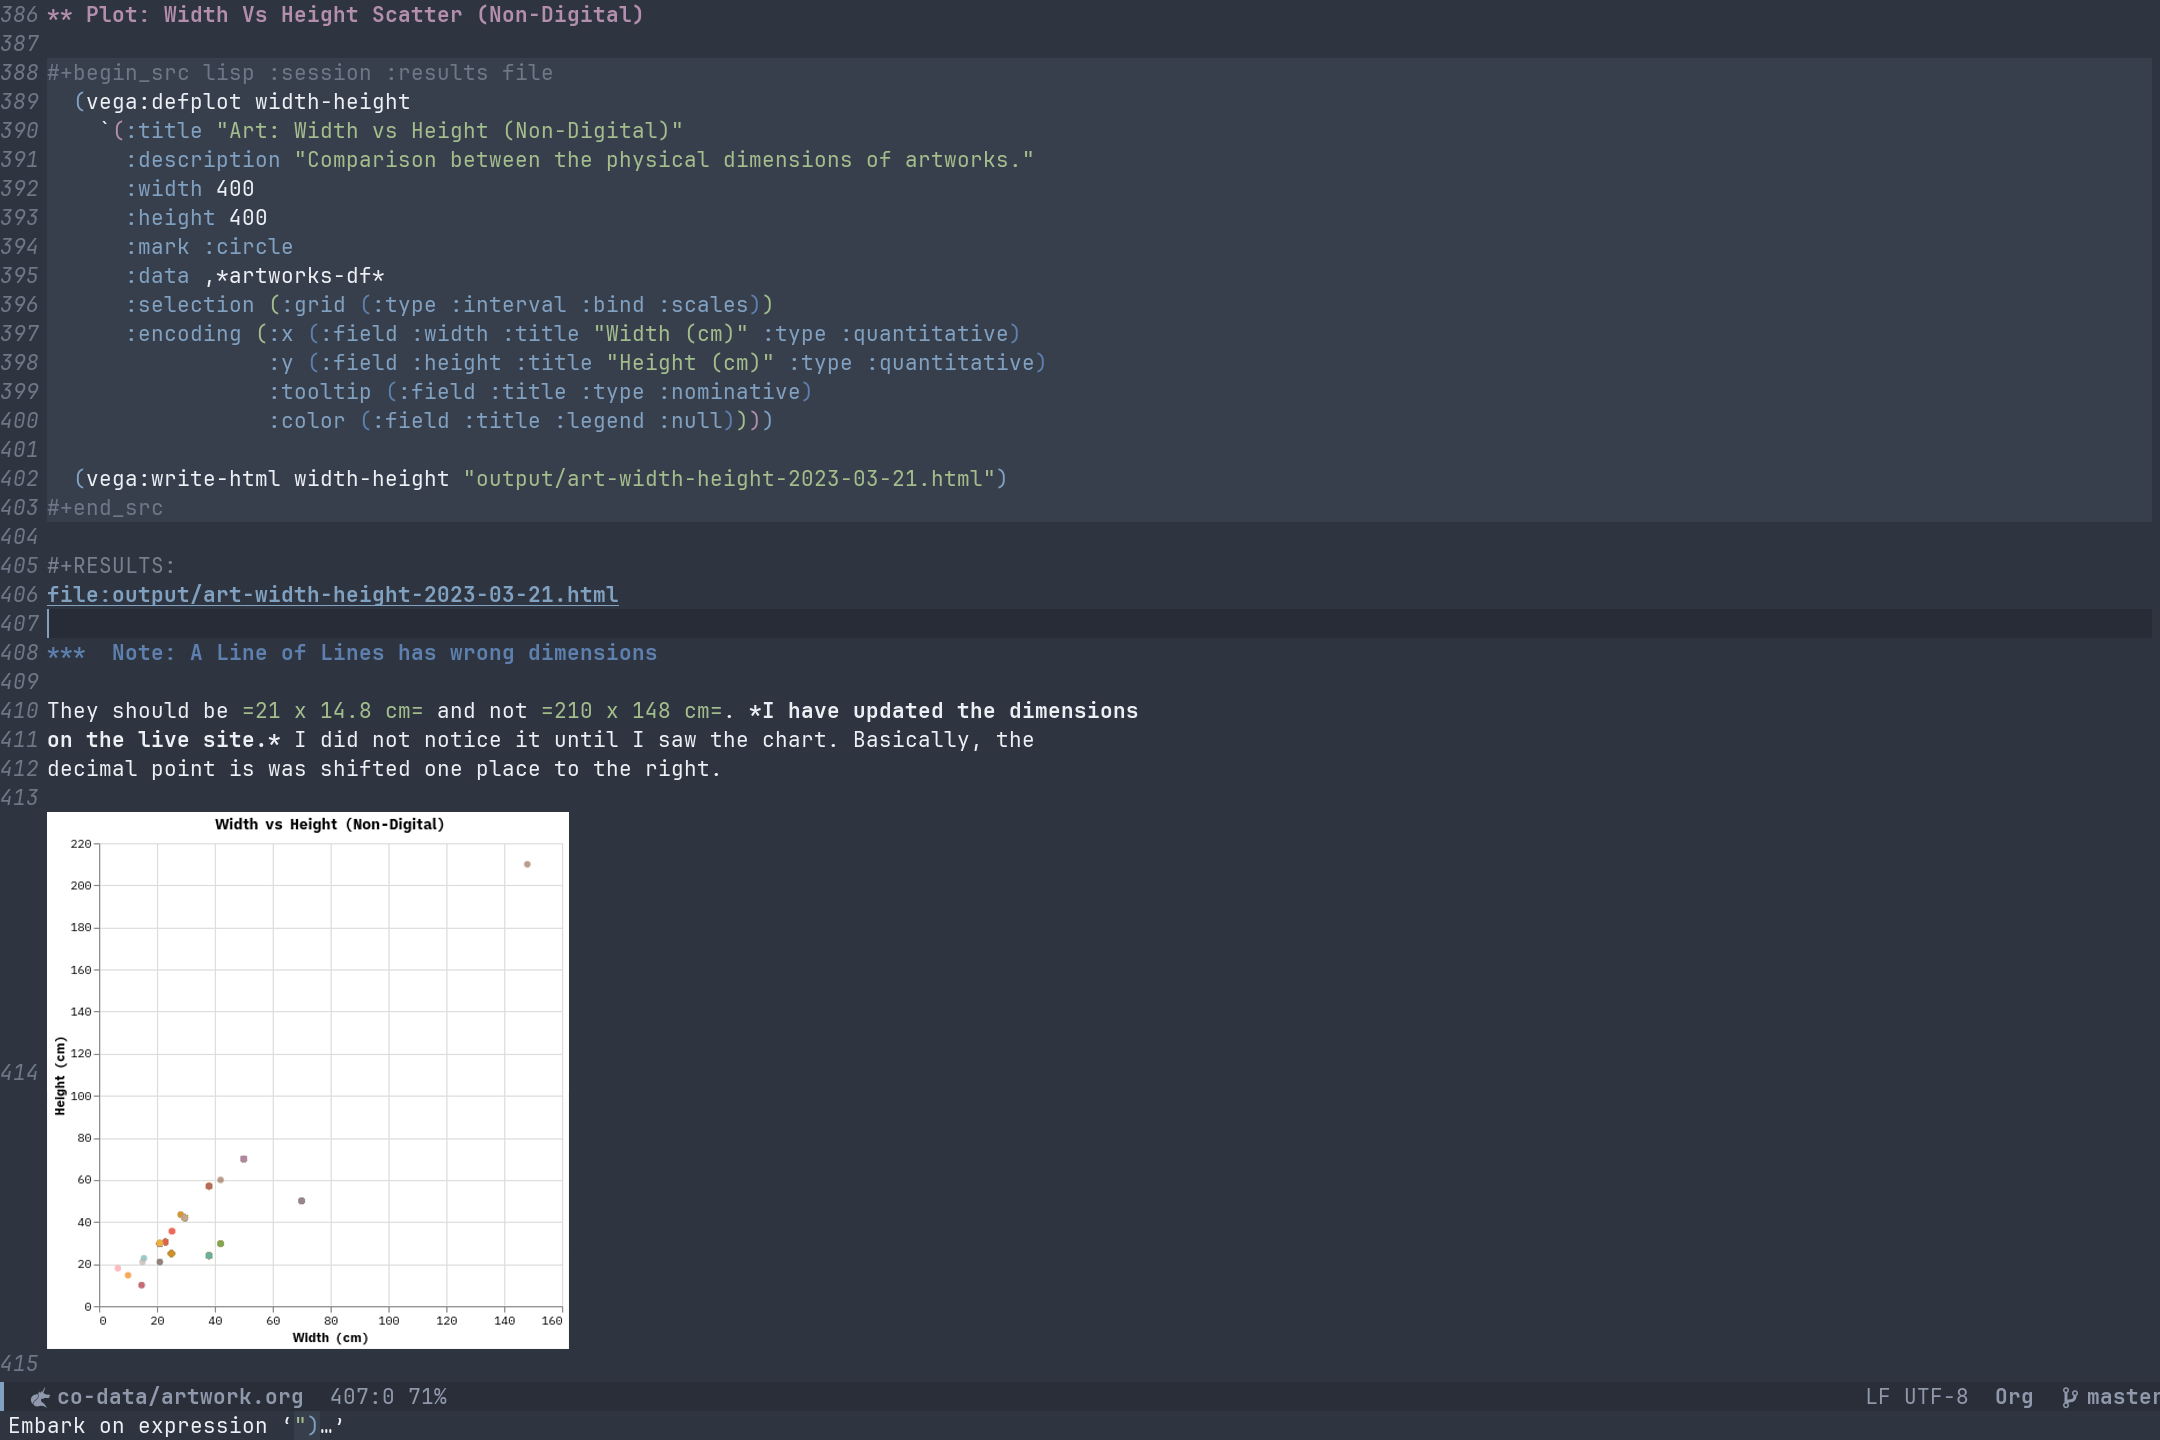 Fig. 1: An example of what a literate program looks like in Emacs.
At the time of writing (December 2023), I'm using this project as a way to compare
Common Lisp and Python for data science (using the term very loosely here)
whilst using org-mode and Emacs. If I'm able to get the data out with Common
Lisp, you will find this project will continue using Common Lisp. If you've read
this and the code is in Python, that means I couldn't get Common Lisp to do what
I needed, and I've not updated this page to reflect that.
Over time, I would like to do annual reviews and see how the trends in my output
changes, over said time. It's not quite the live update of the project's previous
guise. Having said that, it does make interacting with the data more purposeful
(for me at least).
One last thing, I've included a clean version of this site's database in the
CO-Data Git repository. I exported the data as a CSV file so feel free to
explore the data yourself. With the data sitting in a CSV file, you can open it
in Microsoft Excel or LibreOffice if that's more your thing.